Reports & Analytics for Restaurant Management
Data-driven decisions made easy — sales dashboards, product analysis, peak-hour trends, and more.
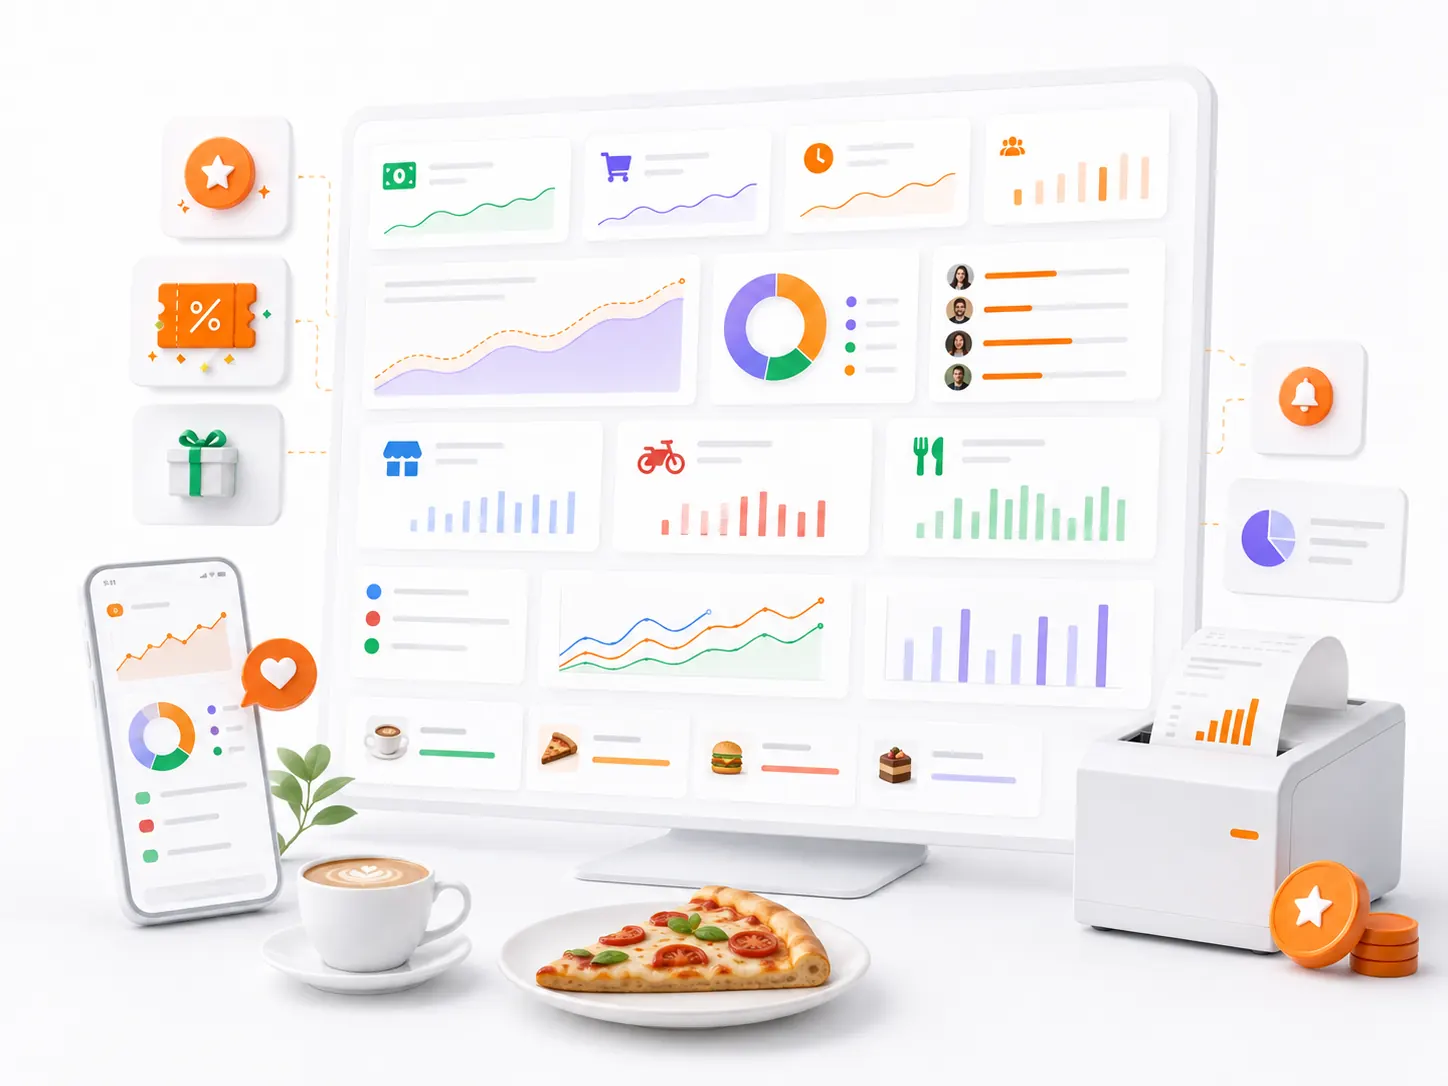
APPY Analytics transforms your restaurant data into actionable insights. Interactive dashboards show real-time sales, product performance, peak hours, staff productivity, and channel breakdowns. Make smarter decisions about menu engineering, staffing, and promotions — backed by data, not guesswork.
Explore AnalyticsTransparent pricing: Starter 0 € · Appy POS from 49 €/mo · See pricing
300+ restaurants already use APPY POS
Which reports does a restaurant actually need?
A restaurant needs three things from its data: how much it sold, at what margin, and what is selling badly. That means sales by day, hour and channel, food cost per dish against its selling price, and a product ranking. Other reports are useful, but those three decide the menu.
- Sales by day, hour, channel, location and payment method
- Product ranking, from the top and from the bottom
- Food cost per dish against its list price
- Average ticket and order count, compared across periods
- Sales by waiter and by production section
- Export for accounting or your own analysis
Challenges
- End-of-day reporting is a manual export from the cash register with limited detail
- No way to know which menu items are profitable and which are dragging margins down
- Staffing decisions are based on intuition rather than actual traffic patterns
- Comparing performance across channels (dine-in vs. delivery vs. takeaway) is impossible
With APPY
- Live dashboards refresh automatically — check sales from your phone, anytime, anywhere
- Product analysis shows sales count, revenue, food cost, and profitability per item
- Heatmaps reveal peak hours and slow periods so you can optimize shifts and prep
- Channel-by-channel breakdown shows where your revenue really comes from
Results
Features
Real-Time Sales Dashboard
See today's revenue, order count, average ticket, and comparison to yesterday or last week — all updating live. Drill down by hour, channel, or payment method.
Product Performance Reports
Rank menu items by sales volume, revenue, and profitability. Identify your stars (high volume, high margin) and your dogs (low volume, low margin) for menu engineering.
Peak Hours & Trends
Heatmaps and trend charts show exactly when your restaurant is busiest — by hour, day of week, and month. Use this data to plan staffing, prep, and promotions.
Channel & Source Analysis
Break down sales by channel: dine-in, takeaway, delivery, online store, mobile app, kiosk, Glovo, Wolt. Understand which channels drive volume and which drive margin.
Staff Performance
Track sales per employee, average transaction value, upsell rate, and hours worked. Identify top performers and provide data-driven coaching.
Custom Report Builder
Build custom reports with drag-and-drop fields, filters, and date ranges. Schedule automatic email delivery daily, weekly, or monthly to stakeholders.
How it works
Data Flows Automatically
Data Flows Automatically
Every order, payment, and item sold is recorded automatically by APPY POS. No manual data entry — analytics are built on real transactions.
Explore Dashboards
Explore Dashboards
Open the analytics section to see pre-built dashboards for sales, products, channels, staff, and trends. Filter by date, location, or channel to drill into specifics.
Act on Insights
Act on Insights
Use the data to adjust your menu, optimize staffing schedules, identify your most profitable channels, and launch promotions where they will have the greatest impact.
Frequently asked questions
Make every decision data-driven
Live dashboards, product insights, and trend analysis — all in your pocket.
Explore Analytics